

#64.4 - April 2023: Weimar hyperinflation and our current trajectory
Money supply contraction, debt ceiling theatrics, and the unexpected deflationary parallels to Weimar Germany hyperinflation

Before we get going:
If you haven’t heard, Twitter is clamping down on Substack links… so you may not see these articles in your Twitter feed anymore.
Get on the email list to receive my work — delivered straight to your inbox so you don’t miss it.
This includes these Bitcoin & Macro updates, previously reserved for investors in my fund — but now, delivered to Substack subscribers every weekend:
Thanks for your support! Okay, now on with our story…
The misery of monetary folly whispers at us from the yellowed pages of the past. But it couldn’t happen to us. They were fools. Fools to pursue such obviously doomed policy. Every ruinous episode of hyperinflation looks absurd in hindsight — humans reduced to silly and impractical behaviors — a thin veneer of comedy that belies the suffering beneath.
But we are different than them, these sad ghosts of the past. We have stunning technology and have advanced far beyond the crude ignorance of our ancestors. There’s no way we could fall into such a blindingly obvious trap of trying to print our way out of debt. The hubris, the gall. That’s them – not us… right?
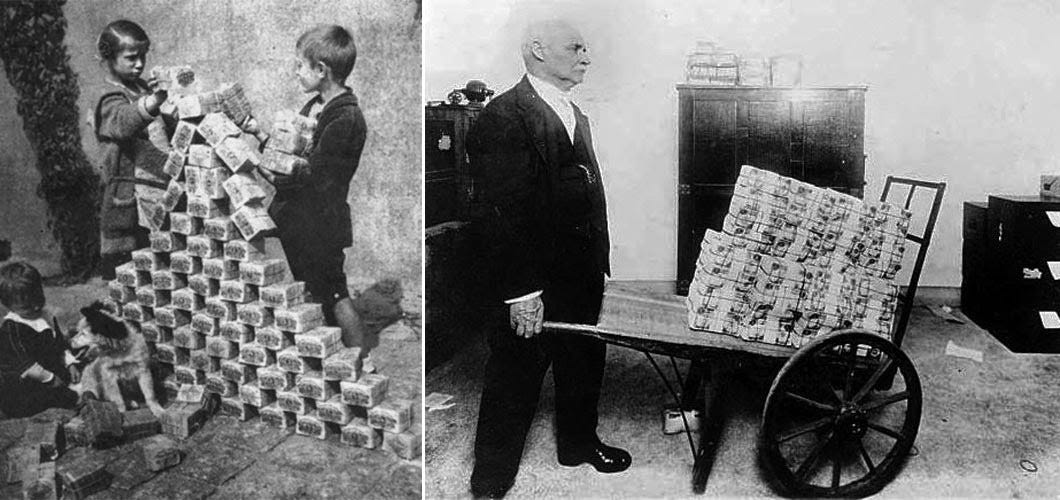
Hyperinflation in Weimar Germany (1921-23)
Everyone is familiar with the general story of Weimar Germany, but it’s worth revisiting the specifics. To pay for WW1, Germany took on a great deal of debt denominated in gold. In order to pay these debts, Germany suspended the gold standard & began to print money to meet its debt payments (1918-1920 above). In this way, the German government was confiscating purchasing power from its citizens and their savings, transferring that purchasing power to newly created paper currency in order to make debt payments.
Upon losing the war, Germany was saddled with even more debt via war reparations imposed by the Treaty of Versailles in June 1919. A mountain of debt. For a few years, Germany was able to meet its obligations. But in 1921, the debt payments became too much. The government was out of runway and they had a choice to make: 1) shamefully default on their international debts OR 2) print as much money as necessary to purchase the foreign currency they needed to make their debt payments.
Naturally, the bureaucrats (headed by Rudolf Havenstein) chose to kick the can as hard as they could. Over the following two years, every person on Earth who held any German marks saw the purchasing power of those assets diluted to zero. After catapulting Germany into the Stone Age for two years, the inevitable exhausted collapse left the country destitute and ripe for populist extremism to scoop up the wounded nationalist spirit and carry it into an even more terrible Second World War.
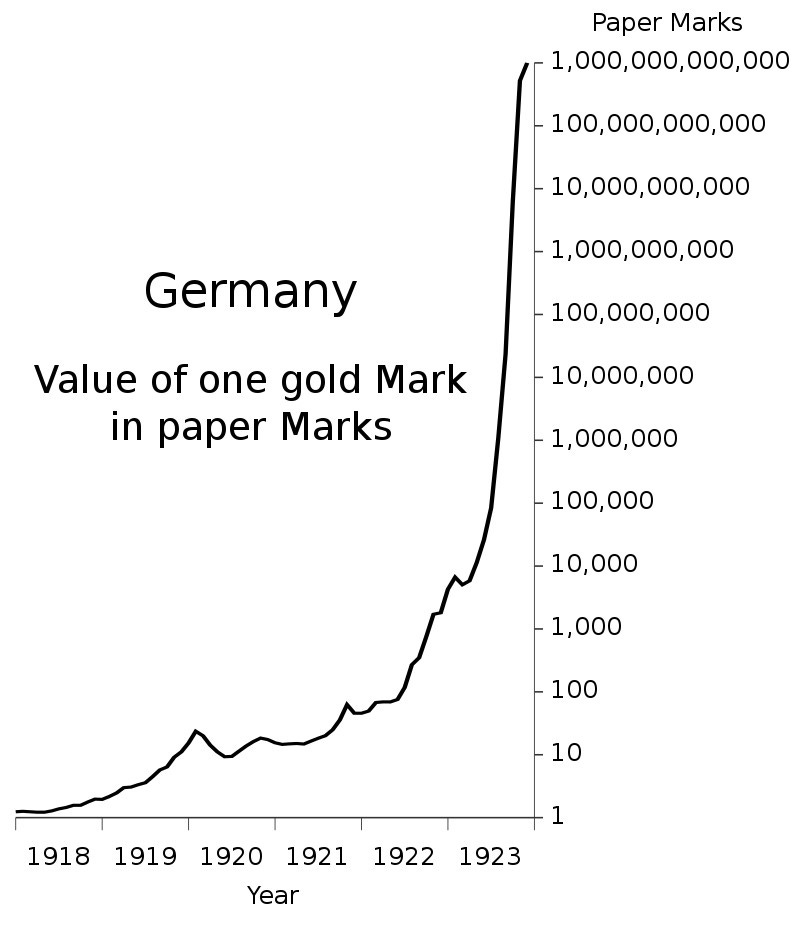
But for our purposes, the most notable element of this quintessential hyperinflation story is a minor detail: Weimar hyperinflation was punctuated by sharp bouts of deflation. At first glance, the chart above looks like a parabolic curve straight to the moon. But if you look closer, there are brief dips along the way. Periods of deflation, short lived.
The monthly inflation rate overlaid on the same data confirms the story: hyperinflation brings volatility, mostly to the upside but periodically to the downside.
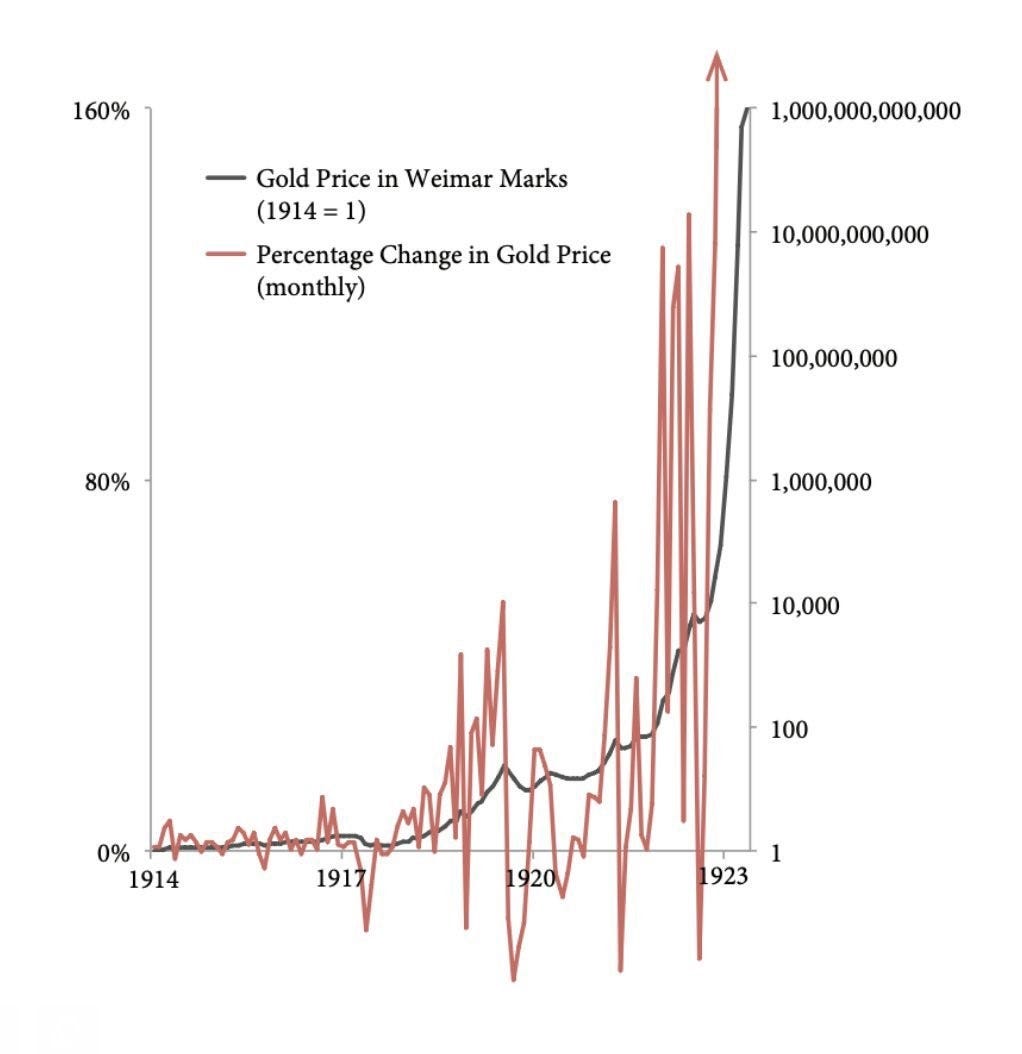
While I do not think that the US is going to suffer the full Weimar experience (particularly because our obligations are denominated in US Dollars which we can print, rather than gold which we cannot), I do believe that we will see the same mechanics play out on a more limited scale.
In terms of the graph above, my assertion that we’ll explore in the rest of this piece is that we’ve just entered that deflationary bout in 1917.
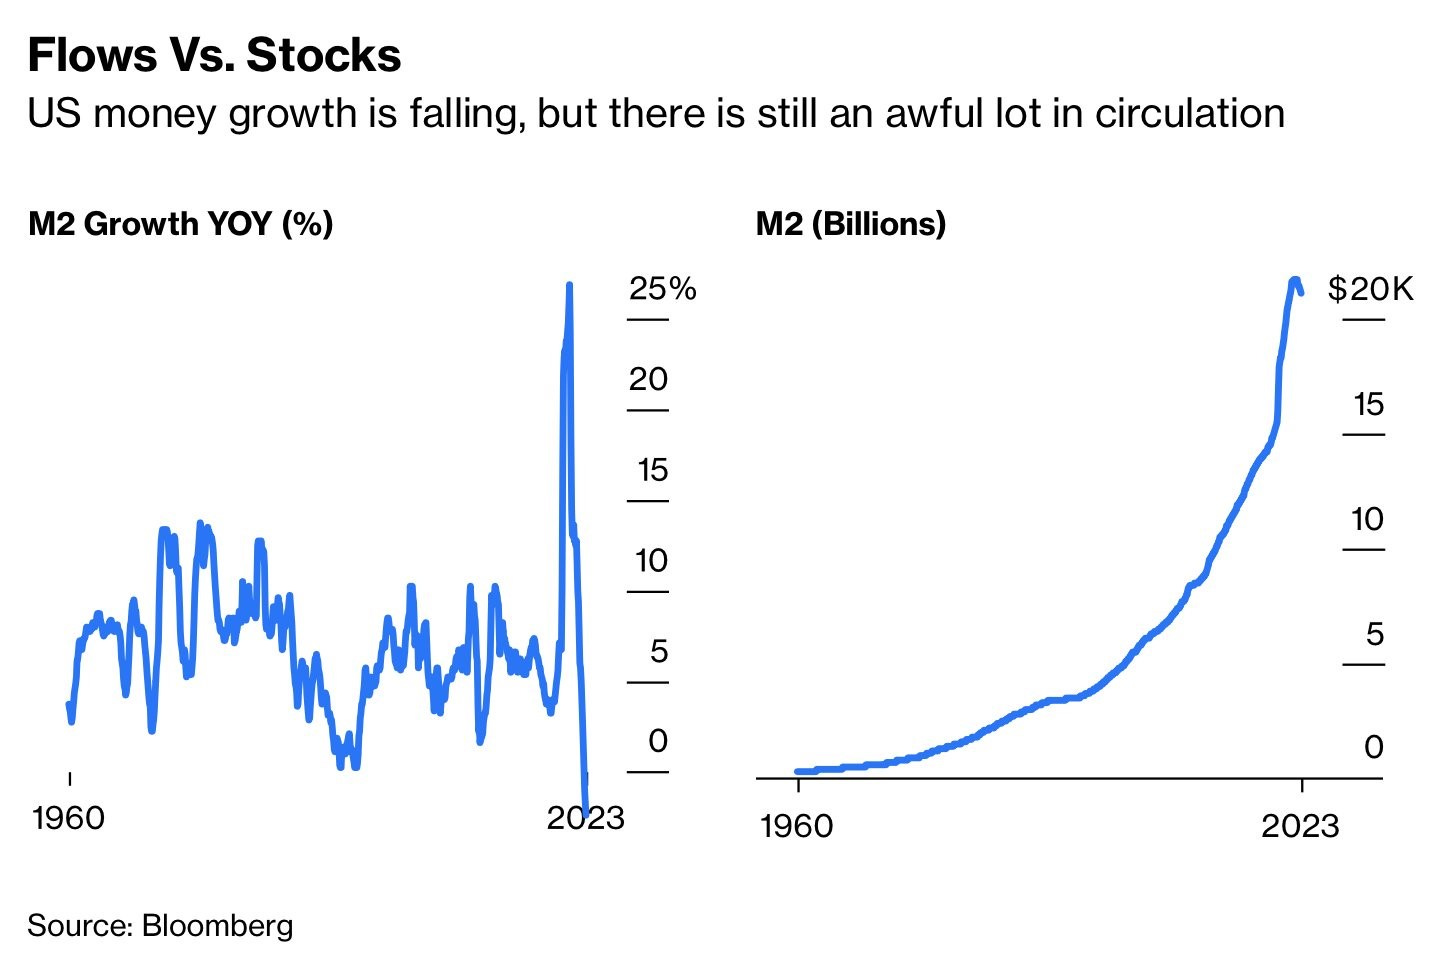
M2 money supply contraction
In our present moment, strange economic tides are swirling. For the first time in modern history, we are currently seeing a notable contraction in the US Dollar M2 money supply.
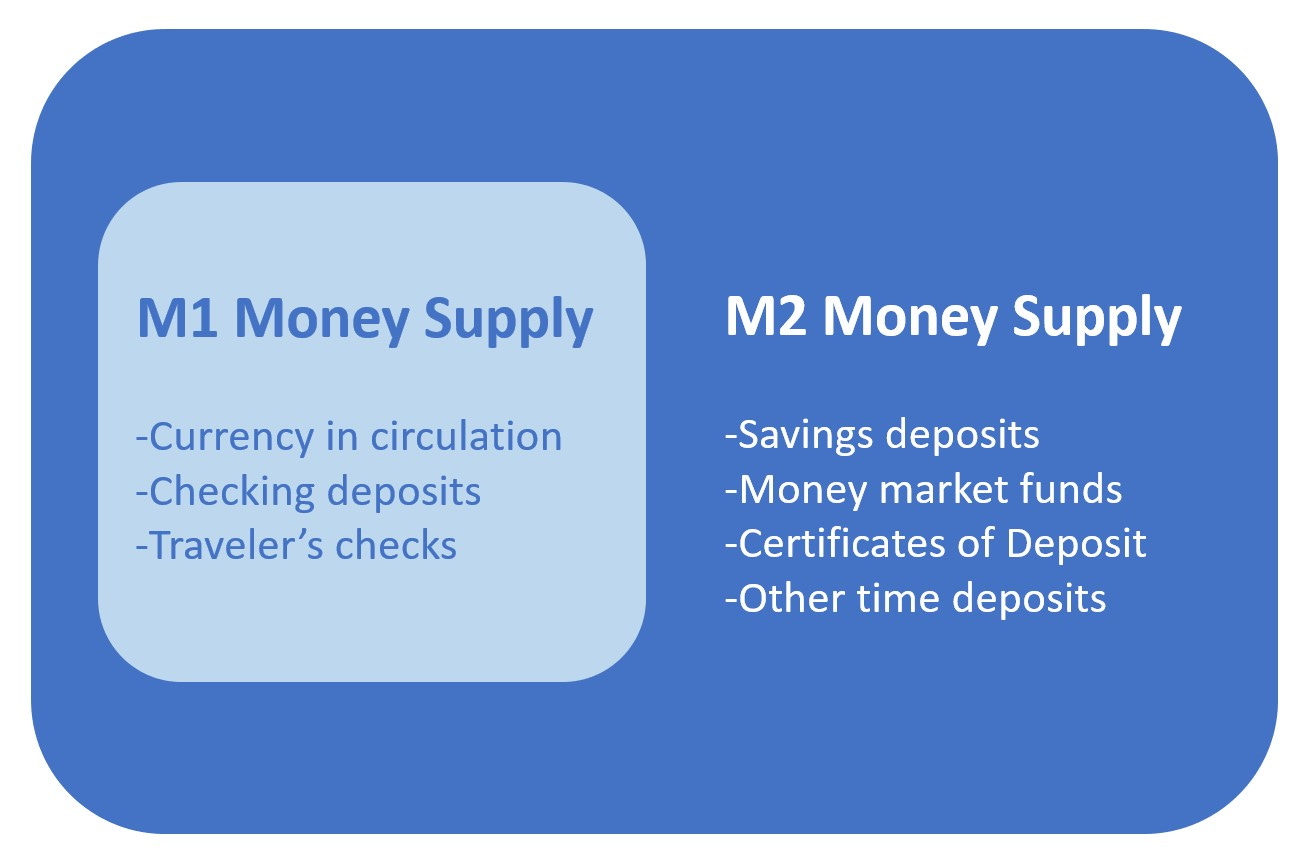
For anyone unfamiliar, the money supply is typically measured a few different ways. The first level (M1) is the amount of actual dollars in circulation – physical bills in your wallet plus the digital number shown in your checking account. The second level (M2) is M1 plus savings accounts, money market funds, and other time deposits. For all intents and purposes, the M2 money supply is the generally accepted metric for measuring the number of dollars in circulation.
Since nobody is burning stacks of dollars as firewood, how can M2 be shrinking? The key here is to understand the accounting mechanics of our credit-based economy. When a business takes out a $1M loan from their bank, they log in to see those dollars in their account. Where did they come from? The commercial bank, as part of the Federal Reserve banking network, created those dollars out of thin air. In doing so, the bank issued themselves a $1M deposit liability on their balance sheet and offset it with a newly created $1M loan asset (which will generate interest income for the bank over time).
All-else-equal, M2 grows as commercial banks issue new loans (creating money) faster than existing loans are retired. Conversely, M2 shrinks when banks retire old loans faster than new loans are issued.
Right now, banks have slowed new lending to a trickle. This is largely driven by the banks’ risk management duty to maintain a certain ratio of bank deposits to outstanding loans – a ratio recently strained by the exodus of deposits to higher-yielding money market funds. It’s happening for prudent reasons, but it’s unprecedented all the same.
The net of it is that M2 shrinking is because of credit contraction. And in our credit-based economy where economic growth requires lending through credit expansion, the opposite trend is generally viewed as a leading indicator for a recession on its way.
The US debt ceiling
The other piece of the puzzle that I want to pull in for consideration is the looming debt ceiling crisis. You may have noticed an old refrain is back in the news cycle – will they or won’t they raise the US debt ceiling?
I’ll spoil the punchline: yes, of course they will raise the debt ceiling. The United States is exceptionally good at saying “yes” to more debt, and neither party actually wants to draw a line in the sand. The true aim is to score political points by pretending to care deeply about the National Debt, before inevitably voting to borrow more anyway. The politician’s creed: spend now, leave the bill for your successor.
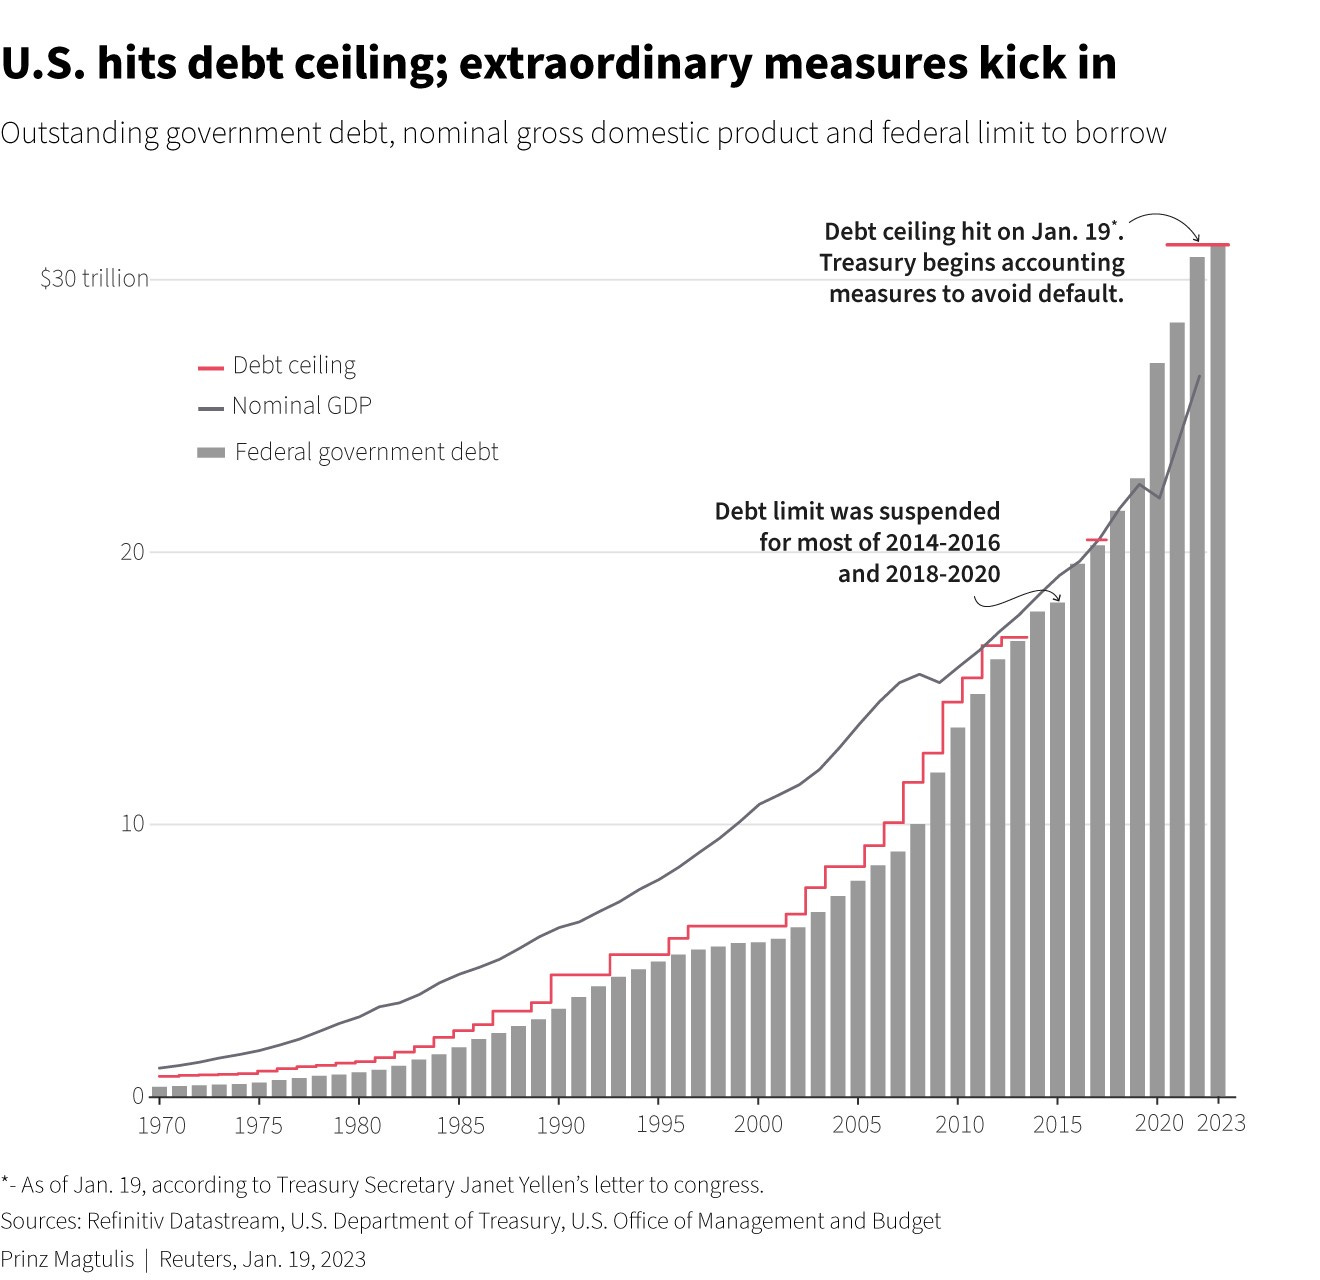
The only uncertainty is how much political brinksmanship will happen before the US takes on more debt. Unfortunately, we’re not off to a great start. In fact, the US technically already hit the debt ceiling back on January 19th. Since then, the US Treasury has been forced to avoid default through “extraordinary” accounting measures (what would probably be considered “cooking the books” if done by anyone else).
While the debt ceiling political theater dominated the news cycle for a number of weeks in 2011, and again in 2013, this time there is cause for concern that the two sides of the aisle have become that much more unwilling to meet in the middle.
For example, in reference to the House Republicans’ debt ceiling objections, the White House press secretary recently said, “We’re not going to negotiate that. They should feel the responsibility.” To which the Republican Speaker of the House responded, “Why create a crisis over this?... It’s arrogance to say ‘Oh, we’re not going to negotiate over pretty much anything’ and especially when it comes to funding.”
By the US Treasury’s estimates, lawmakers have until June to sort out their differences. After that point, the “extraordinary” accounting measures keeping the lights on will be out of runway. Will the politicians be able to make a deal? According to the market… there’s cause for concern.
Here is the scariest chart in finance right now:
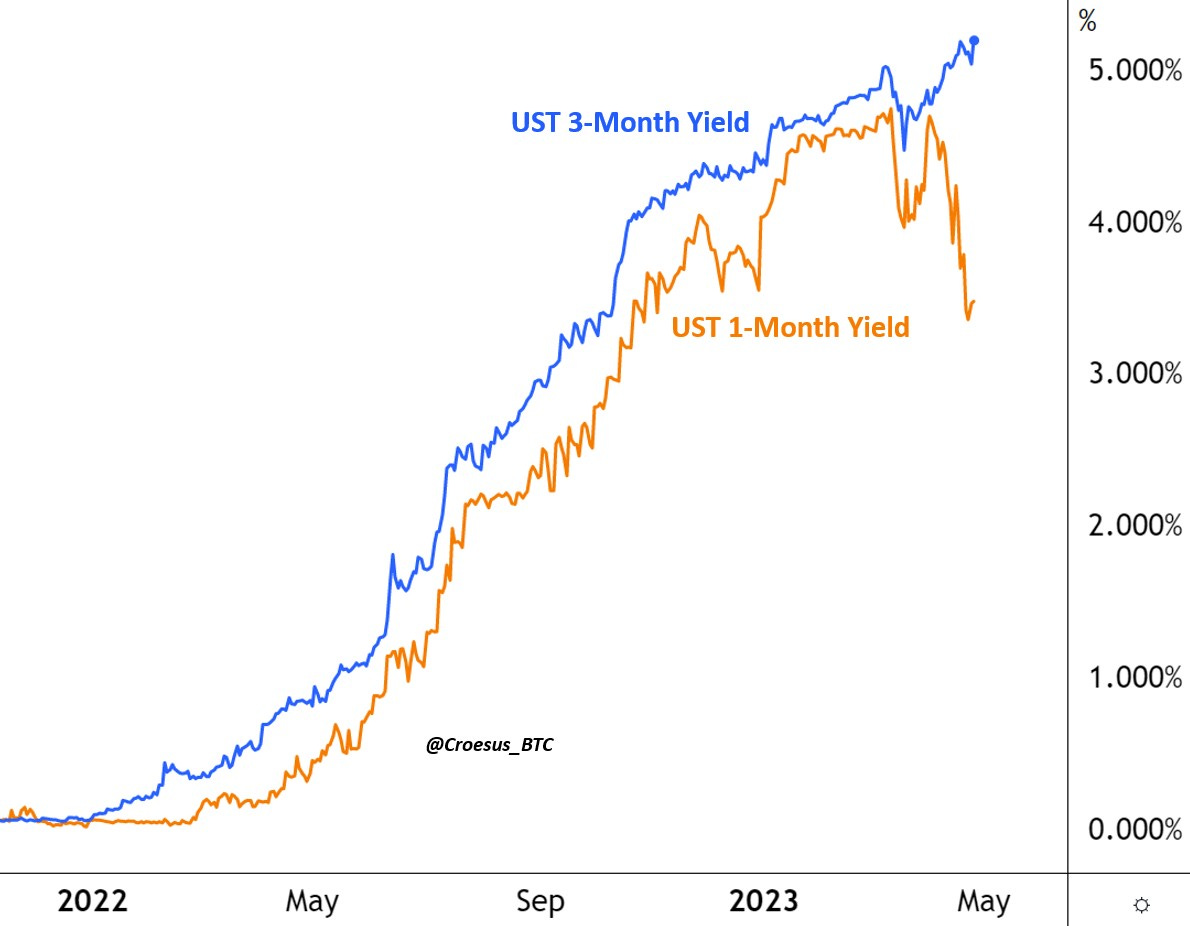
See the recent divergence in Yields between 1-month duration and 3-month duration US Government debt?
This has never happened to this extent before, and it shouldn’t ever happen.
Let’s dig in to:
Why it’s happening
What are the likely outcomes
What it means for your portfolio near-term
What it means for assets (and Bitcoin in particular) in the long term