

Double digit inflation is coming
Why the current disinflationary trend sets up the medium-term need for massive stimulus which will fuel the next wave of inflation, just like in the 30s-40s and in the 70s

Before we get going:
If you’ve enjoyed my articles or content on Twitter (@Croesus_BTC), you’ll love my free weekly Bitcoin newsletter, “Once-in-a-Species.”
1-2 posts a week to help you understand why Bitcoin could be the key to growing your wealth this decade.
Get on the free email list to receive it: 👇👇👇
Thanks for your support! Okay, now on with our story…
In the past few weeks, my updates have focused on how the banking crisis represents a major turning point – the end of 15 months of Quantitative Tightening, and the beginning of a new era of Quantitative Easing (i.e., money printing).
In general terms, we all understand this as a welcome change from the cold breeze of tight monetary conditions that financial markets have dealt with over the last year. But everything has its cost, and the reason that the Fed embarked on this unpleasant tightening regime (too late and too aggressively) was to rein in the intractable dangers of inflation.
What will the resumption of easy monetary conditions mean for inflation – where does inflation go from here? And what will that mean for the assets in your portfolio?
Now – crisis. Soon – stimulus. 12-18 months later – double digit inflation.
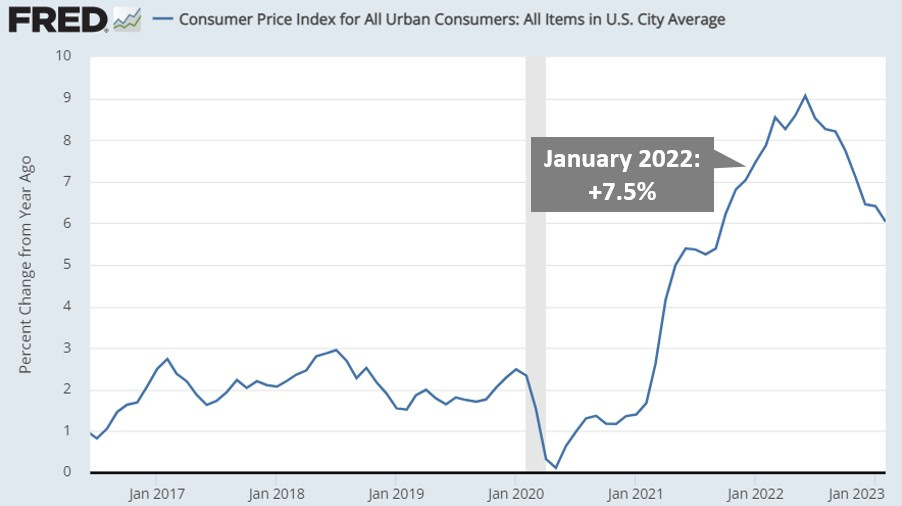
To begin, in my January 2022 update to investors in my fund, I characterized my base case for inflation in 2022: “My rough expectation is that inflation stays in the high single digits for most of this year. I will not be surprised to see double digit inflation at some point in the next few years.”
And that is how 2022 ended up playing out…
But that January 2022 prediction was a two-part statement – high single digit inflation for 2022, double digit inflation at some point in the subsequent few years. Only the first half has come to pass… so far.
How do we get to double digit inflation from here? In simple terms, print trillions of dollars and wait 12-18 months.
And what is happening now, in response to the banking crisis? They’re warming up the money printer.

The Fed’s new Bank Term Funding Program (BTFP) is a blank check to banks who are holding bonds whose market value has fallen under their purchase price. These unrealized losses combined with historic deposit outflows are the reason for the current banking crisis. And the Fed has already stepped in to offer that blank check to backstop banks, preventing more bank failures and subsequent contagion (i.e., even more bank runs).
But this measure amounts to little more than a prelude for what’s to come – the themes are all there, but it’s just a preview of the main event. The elephant in the room for global macro right now: yield curves are screaming “recession ahead.”
Yield Curve Inversion
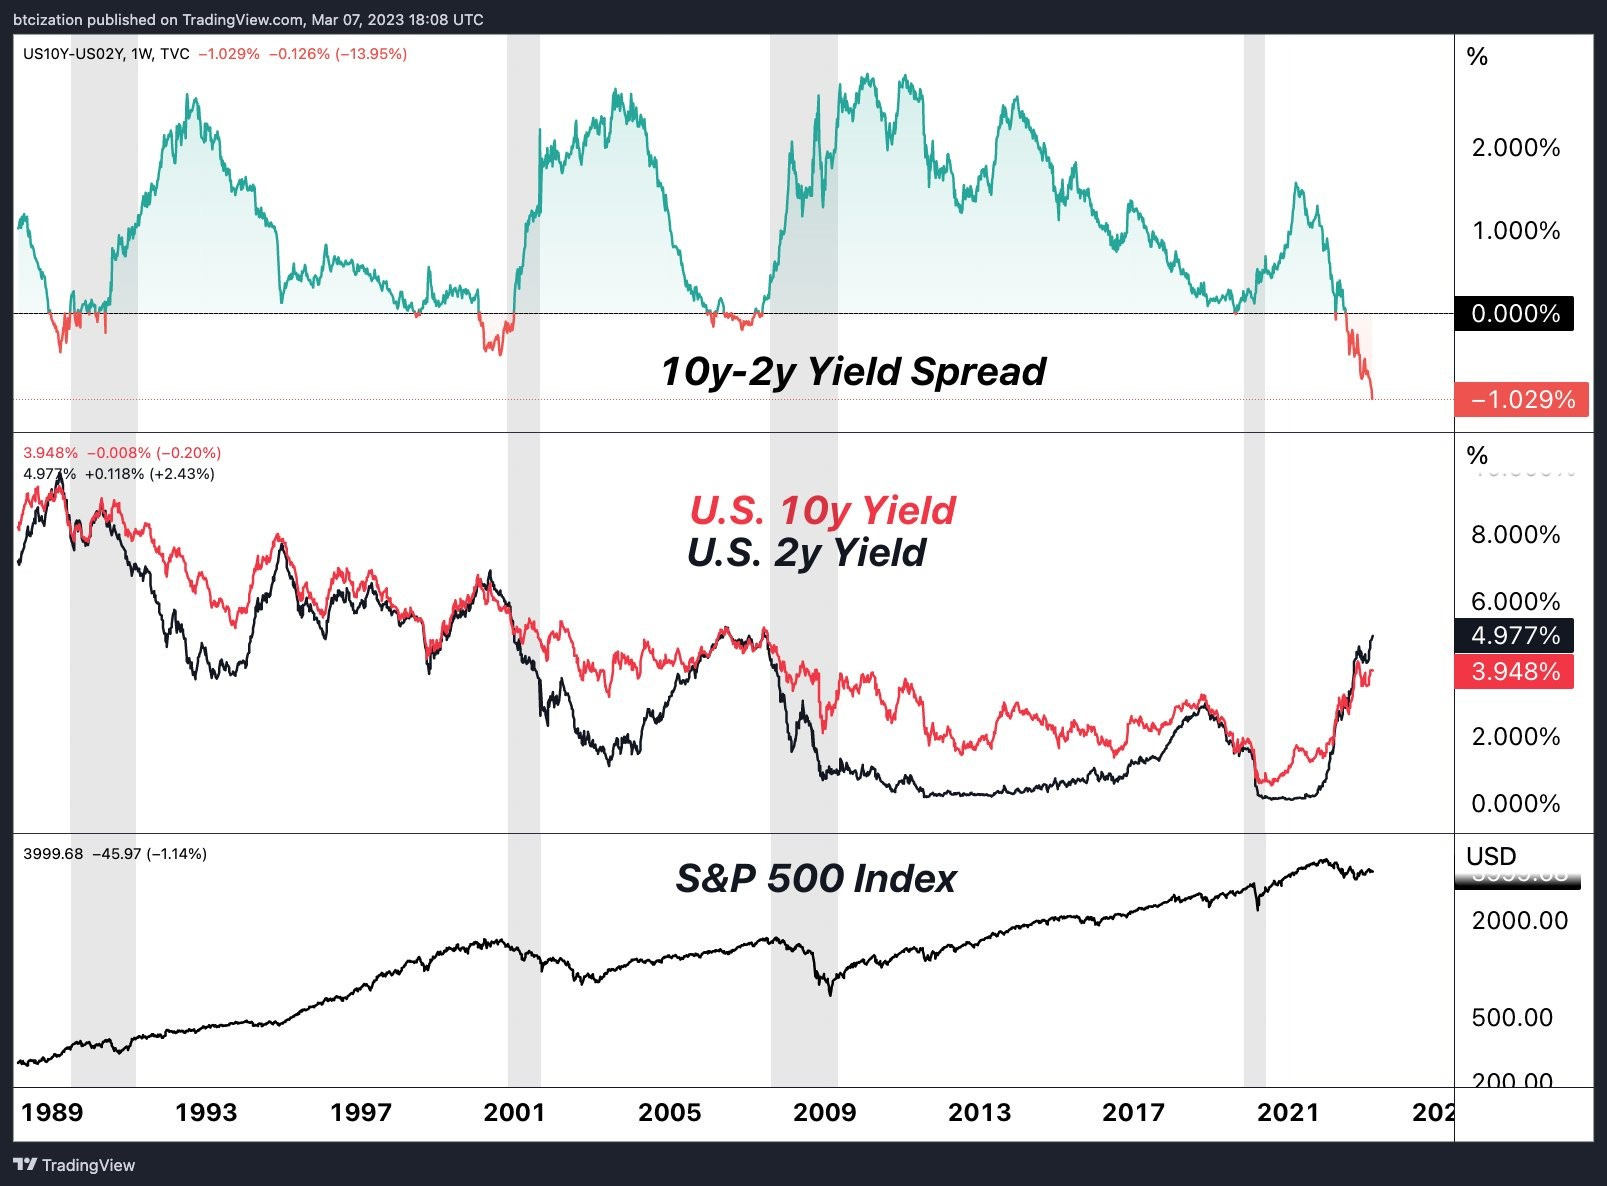
This chart summarizes the situation all in one view. What you should know:
When US Treasury bills with 2-year durations see their yield % dip below US Treasury bills with 10-year durations, this is called a “yield curve inversion.”
Typically, you’d expect to receive a greater annual return for locking up your money for 10 years instead of just 2 years.
An inversion means the norm has flipped, because the bond market is expecting a recession within the next two years.
A yield inversion of the 10-year and 2-year Treasury bills has historically predicted an imminent recession with perfect accuracy.
Yield inversions typically precipitate a local-top for interest rates.
After an inversion, bond yields drop (meaning, investors bid up the price of bonds) as a result of policymakers easing back on interest rate policy & investors shifting portfolio allocations from stocks to bonds in anticipation of a recession.
A recession typically arrives only once the yield inversion has unwound.
That recession comes with a stock market sell-off, or at least a period of sideways stagnation.
We are currently looking at the deepest yield curve inversion in modern history.
In fact, if you zoom in on this data, the events of the last few weeks have begun to close the yield curve inversion (because bond yields are dropping, with the bond market pricing in its expectation that the Fed will have to decrease interest rates this year).
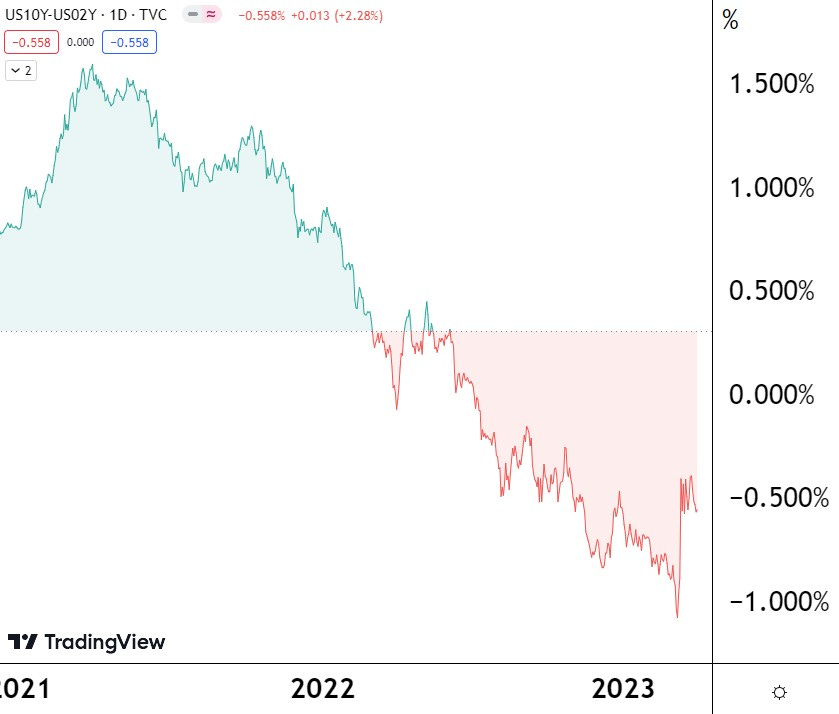
If the decades-long pattern of yield curve inversions being followed by economic contraction holds true, we have reached the point where things get tough for stock valuations and employment figures.
And it’s no surprise at all, considering that the Fed hiked interest rates from ~0% to 5% in just a year. The financial sector is reeling, as all bonds purchased by companies in the last few years are now underwater. This impacted the banking sector fastest, but now it’s threatening two other industries where whiplash from interest rate hikes is similarly painful: insurance & commercial real estate.
Trouble in insurance
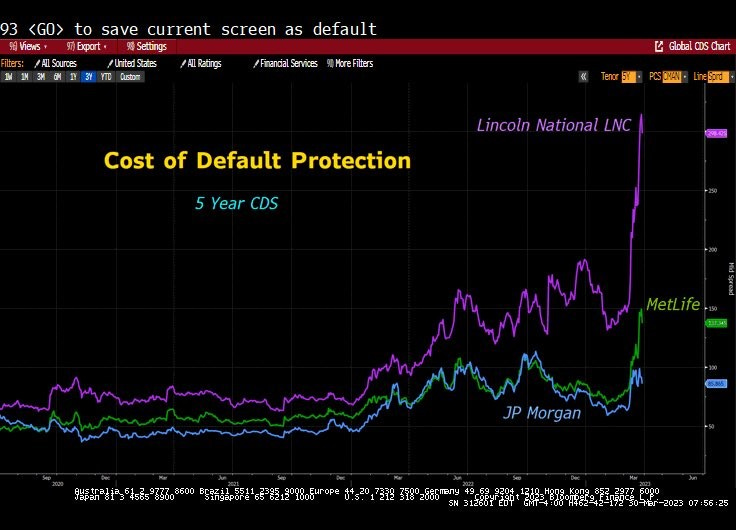
Insurance companies hold a large portion of their assets in “safe” yield-generating assets like commercial real estate or US Treasuries. This means that the insurance industry is dealing with large unrealized losses on their balance sheets, as a result of these “safe” assets taking a steep hit to their fair value as a result of interest rates jumping from ~0% to 5% (the same mechanics that imperiled the banks).
As a result, Credit Default Swap prices have recently jumped for several large insurance companies – the market thinks the probability that unrealized losses on balance sheets cause insurance companies to fail is rising. This is particularly true for Lincoln National Corporation, a Fortune 200 insurance and investment management giant, that the market suddenly views as in danger.
Trouble in commercial real estate
The tide has gone out for the commercial real estate sector, but the reckoning of loans coming due has just begun. The most sensitive lever for commercial property owners’ profitability is the cost of debt. Before 2022, the industry operated in a near-zero interest rate environment. But now, rates are 5%+, and as time goes by, more and more loans are set to mature. Refinancing these loans at today’s higher rates can make a previously profitable asset into a loser.
Over the next 5 years, $2.5T in commercial real estate loans will come due. Many owners will be forced to sell these properties at major markdowns (made worse by the fact that the shift to work-from-home has already deflated demand) and some will be forced out of business. Commercial mortgage-backed securities indices are already selling off sharply in anticipation:

To make matters worse, 70% of these commercial real estate loans are ultimately owned by small banks, already under major pressure from the combined forces of the banking crisis (deposit drawdowns & underwater bonds on bank balance sheets).
It's an easy leap to see how the Fed may be inclined to expand the current scope of the BTFP to include underwater commercial real estate debt. This seems like an inevitable step at some point in the next year, unless the Fed preemptively drops interest rates dramatically (which they won’t do, because they can’t lose face like that after fighting this hard to raise rates & will instead do what they always do - wait for things to break before flying into action to save the day).
The fuel that will create 10%+ inflation
By this point, we’ve walked through how the banking system is not an isolated problem – bank woes are just the canary in the coalmine for a financial system dealing with the ramifications of interest rates unexpectedly hiking from ~0% to 5% in a year.
The yield curve inversion is just the metric that summarizes all of this pressure. It is confidently saying that large portions of the credit market are in trouble, and entire industries along with it (banking, insurance, and commercial real estate, to name just a few).
And what will inevitably happen when these forces continue to unfold into economic pain across the financial landscape? The powers that be will do the same thing they did in 2008. The same thing they’ve already done for banks this year with the BTFP… the Fed will have to print money out of thin air to backstop “systemically important” financial institutions and entire industries.
The Covid stimulus was ~$10T in the U.S. The BTFP is already slated to be a ~$2T program (and could expand).
How much more will be printed to stimulate out of a recession? $10T? $20T?
The Covid stimulus delivered a wave of inflation that peaked at ~9% (officially) and has ebbed to 6% (with the generous help of the Fed’s demand destruction via QT). Add another round of stimulus on the same scale (starting from mid-single digit inflation instead of ~0% in 2020) and that’s the recipe for 10%+ inflation 12-18 months later.
Now, what will double-digit inflation mean for the assets in your portfolio?
And in particular, what will it mean for Bitcoin? Let’s dig in…
Hard money shines during times of high inflation
The category that appears poised to shine during a period of high inflation is the same as in the past: hard money. Traditionally, this has meant gold (and no doubt you all know a goldbug or two in your social circles), and now it also means Bitcoin. But why would hard money shine in an environment like the one we're in?
Perhaps the easiest way to tee this up is to point out what happened the last time inflation ran hot for years. In 1980, the value of all the world's gold was $2.5T; the total value of the world's stocks was $2.5T. Today, gold holds $13T in value; the total value of global equities is $115T. This means that since 1980, equities have outperformed gold by ~9x.

And that's no surprise. As a reminder, interest rates peaked in 1981 at 15%+, after inflation ran hot through the stagflation 70s. Since then, interest rates have been on a 40-year downtrend, driving a 40-year bull market in bonds and an unprecedented era of financial asset price appreciation in equities and real estate.
Since interest rates are the denominator underpinning all discounted cash flow valuation models, falling interest rates mean future cash flows are worth more & simultaneously enable individuals and businesses to take on greater leverage to juice returns further. But that's the story of the boom since 1981 - what were the years like leading up to that 1981 turning point?
From 1972 to 1980, CPI inflation climbed from 3% to 14%. Over that time period, the S&P 500 was flat in nominal terms. Adjusted for inflation over that time period, stocks were down in real terms. This is because rising inflation and rising interest rates created the opposite dynamics from those described from 1981 to the present: future cash flows were discounted more heavily in present value terms, and the higher cost of debt resulted in deleveraging and reduced green-lighting of capital investment projects.
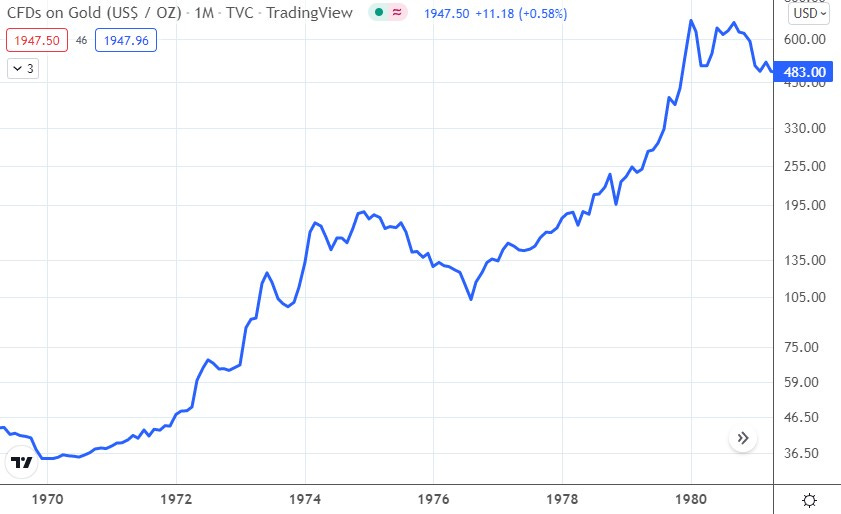
But what did well during these conditions in the 70s? Gold. From 1972 to 1980, the price of gold per ounce went from $48 to $680, a 14x. When inflation is running hot (causing asset valuations based on discounted future cashflows to suffer), the best refuge is in assets whose value is not based on the purchasing power of dollars (now or in the future), but rather is based on scarcity. The appeal of "hard" money (meaning, money that is hard to make more of) is that it is not subject to the easy debasement of printing more money, and in theory retains its relative purchasing power during times on inflation - that's why gold is known as the prototypical inflation hedge.
And that's why gold was the star asset of the 70s. In the cohort of famed Wall Street investors, many built their careers and fortunes by identifying the gold bet early and riding the subsequent 14x, Paul Tudor Jones, Stan Druckenmiller, and Bill Miller among them. And it's no coincidence now that these three men have all become bullish on Bitcoin, explicitly comparing it to gold in the early 70s.
Bitcoin is poised to shine brightest
To bring it back to our starting point, the macroeconomic conditions are setting the stage for a secular shift from cashflow-based financial assets towards commodities and hard money. But whereas gold was the only hard money on the block in the 70s, now there is Bitcoin too. Bitcoin was designed to take the hard money strengths of gold (specifically, its scarcity - just 2% supply dilution each year from global gold mining efforts) and improve upon them with the halving of Bitcoin's supply dilution rate every 4 years. Currently, Bitcoin's annual supply dilution rate is 1.8%. It will halve again in 2024, 2028, and in 2032 it will drop again to just 0.225%.
Because of this increasing scarcity over the course of this decade, plus its other digital advantages over gold (dematerialized, easier to send, easier to store, easier to audit, more liquid markets, etc.), Bitcoin stands to eat market share away from gold in the hard money space. Currently, at $500B, Bitcoin represents ~4% of hard money. I would not be surprised if at the end of this decade, that number was more like 50%.
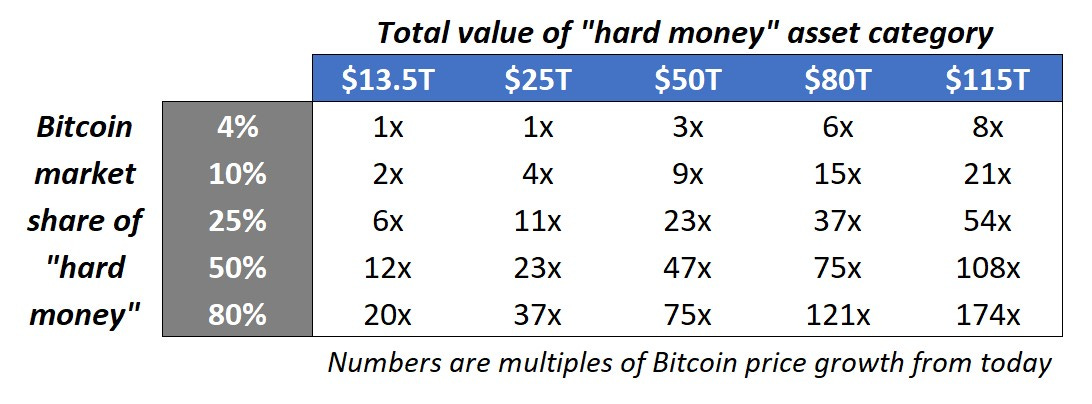
Simultaneously, I expect the current total value of the "hard money" asset category (meaning gold + Bitcoin) will grow from its current $13.5T. To mirror the parity that was achieved in 1980 between gold and global stocks would mean the collective value of hard money reaching $115T.
But maybe “hard money” only gets part of the way to those lofty levels. With this in mind, we can put together a simple sensitivity table. The left side shows Bitcoin's possible market share of "hard money" total value, while the numbers across the top are possible total values for "hard money" as a category. The numbers in the table are multiples, showing how much Bitcoin's price would increase for each of the respective combinations of x-axis and y-axis variables. Note that the top left is today's state, and therefore a 1x. For context, a 10x outcome would put Bitcoin at $280k/coin, or $5T in total value - at this valuation, Bitcoin would represent ~0.5% of the world's asset value. A 35x would mean $1m/Bitcoin.
For decades, goldbugs have been waiting for these conditions and this moment to arrive. Now that it is here, Bitcoin stands to steal gold's thunder and outshine it as Bitcoin's mechanics of increasing scarcity in the digital age continue to play out.
The takeaway…
If double-digit inflation is coming, “hard money” does best during periods of high inflation (like the 1970s), and Bitcoin is poised to outperform in the “hard money” category…
…are you positioned accordingly?
Did you find that Bitcoin analysis informative? You have a choice now:
Leave this page & forget how to find my work again, OR
Sign up for this free weekly Bitcoin newsletter to receive posts like this. My goal is to help you understand why Bitcoin could be the key to growing your wealth this decade: 👇👇👇
Well done...easy to understand while framing the issues at had clearly....Very Compelling...
Satoshi built bitcoin for times like these. He knew it was inevitable the cycle would repeat.
Nothing is more powerful than an idea whose time has come.